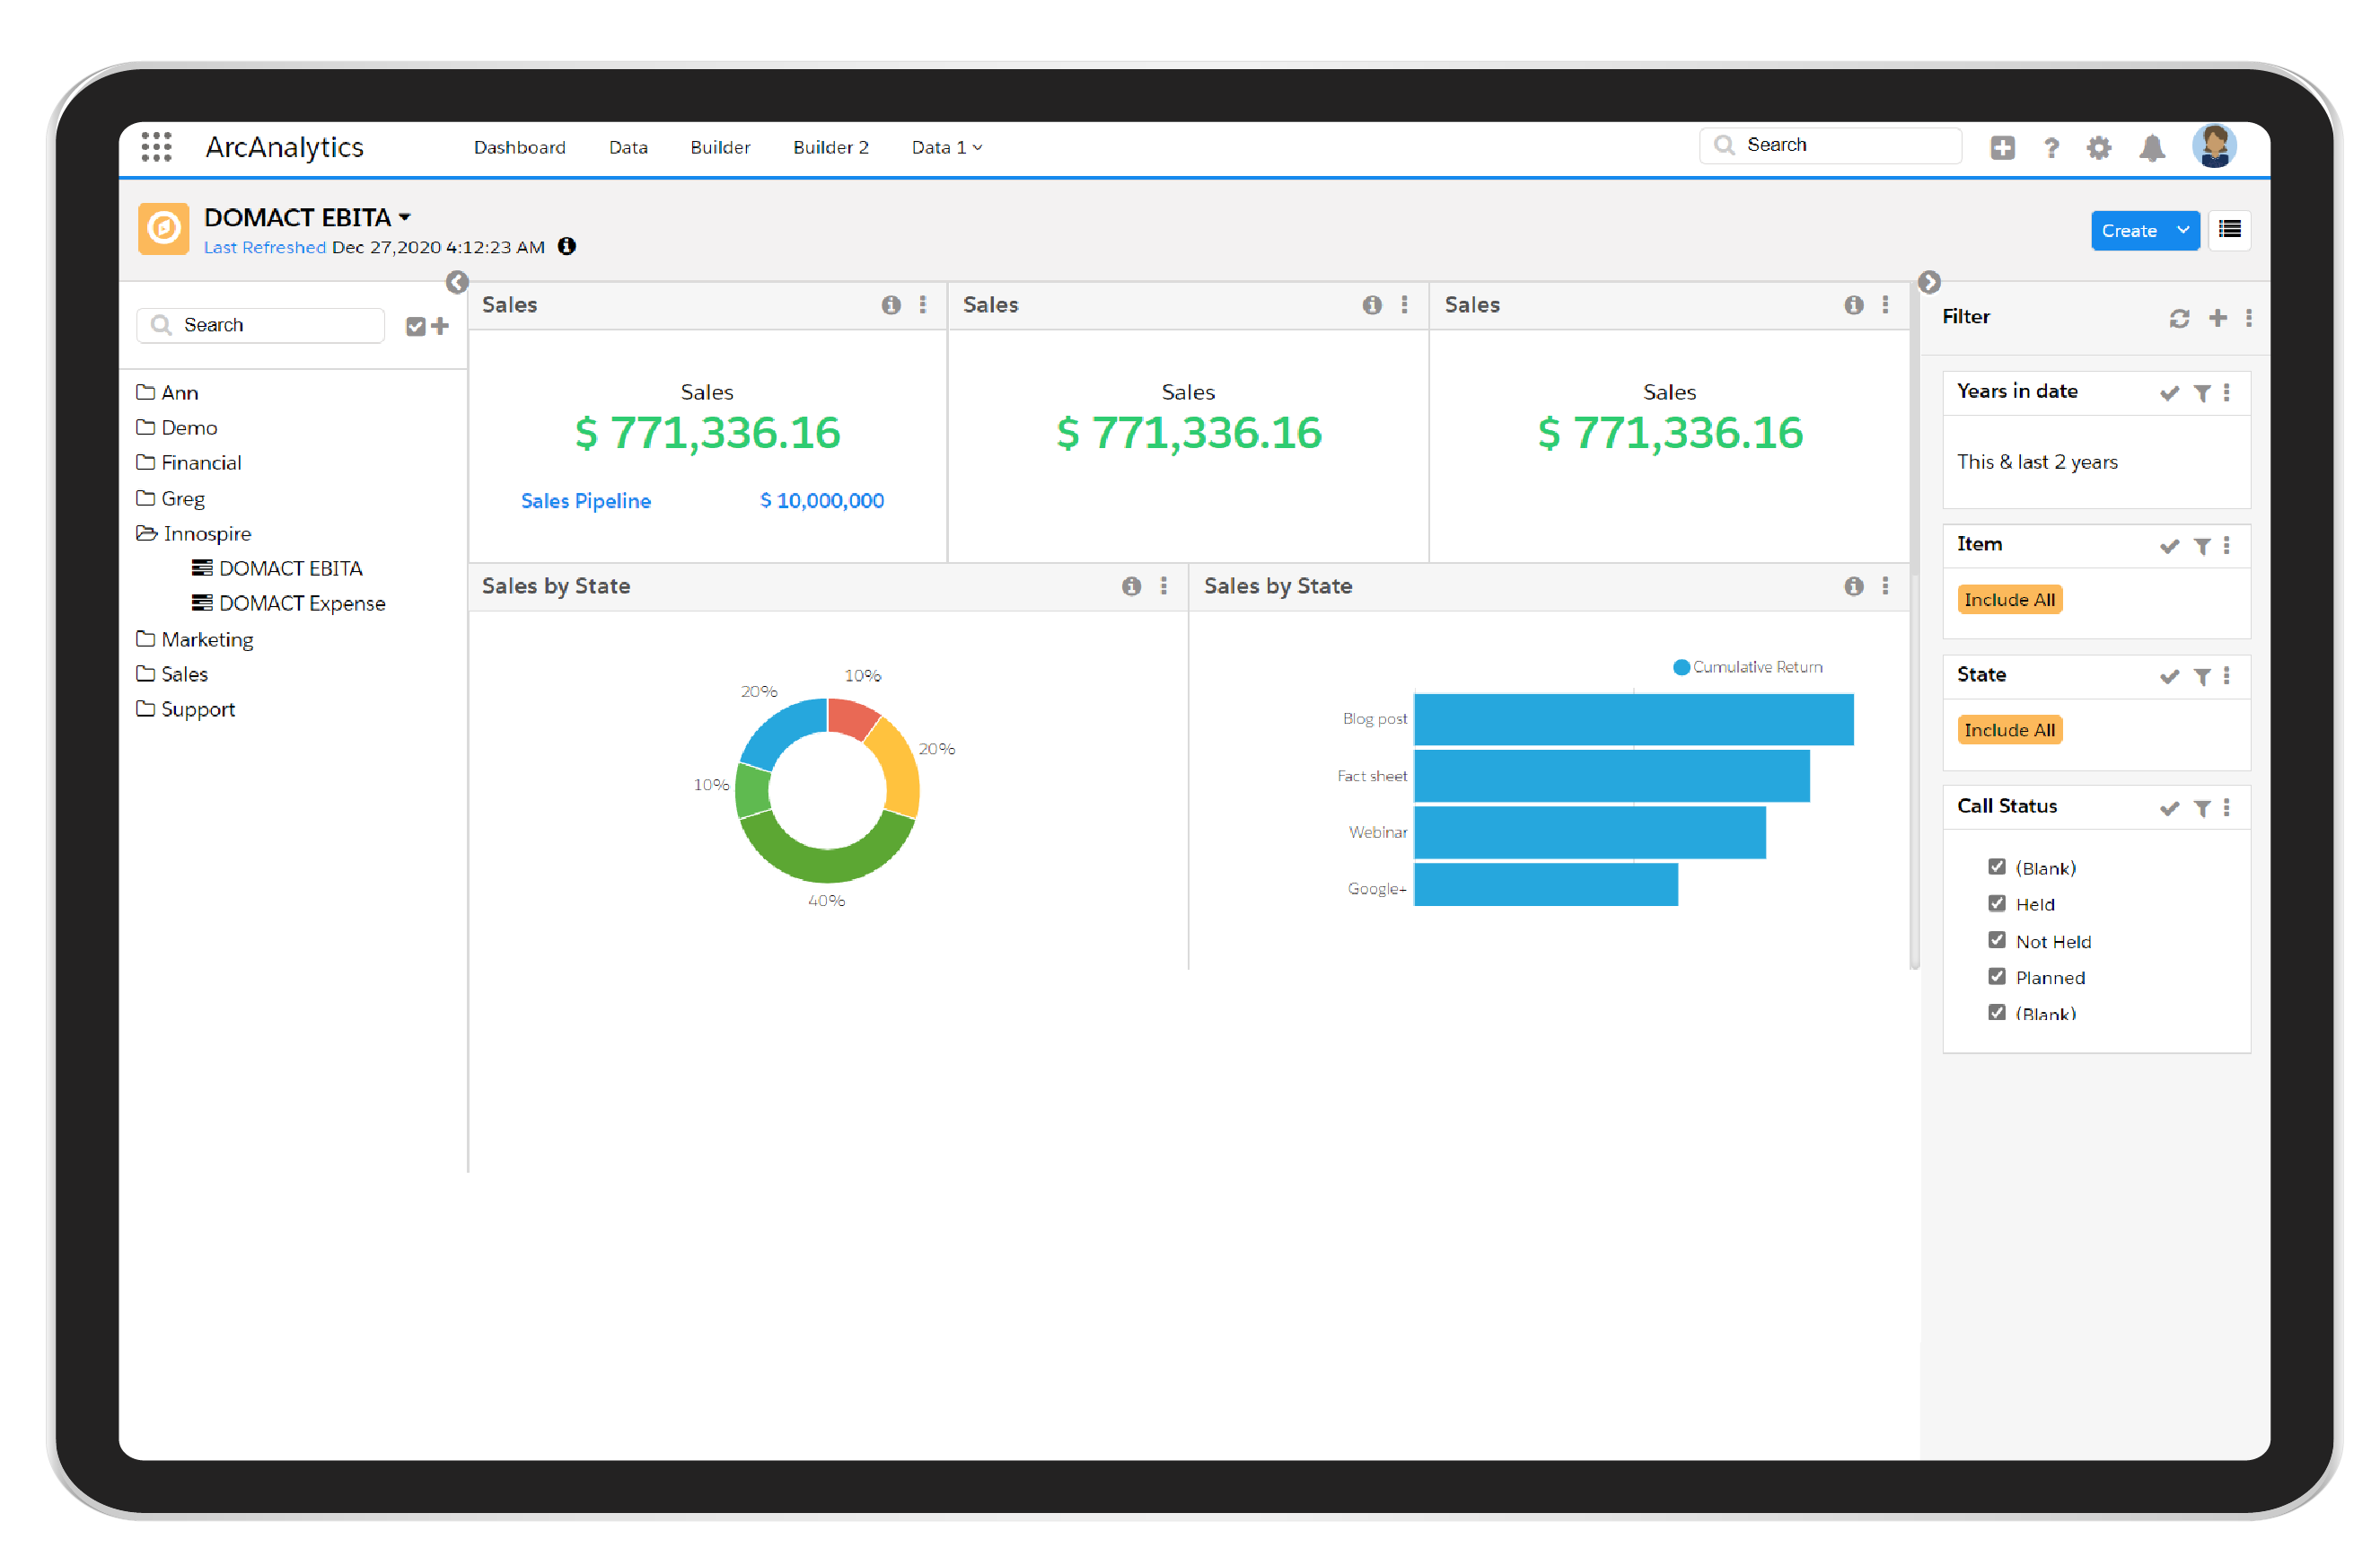

Business Dashboards
- Customize dashboards using key business metrics and add of your choice.
- Download the dashboard data in PDF format as an image
- Group the dashboards specific to team needs and configure the access rights.
- Drag and drop or rearrange the widgets to the dashboard page and connect it to a data source.

Data Visualization
- Easy-to-build visualizations using a library of chart types and other components.
- Add filters to different attributes of your data to quickly find answers to the pressing business questions
- Color-coded visualizations to drill down on key business metrics (for example- sales figures, top-selling products, etc.) and to give a birds-eye view of overall operations.

Data Builder
- Pool the data from different business functions, viz. from sales, marketing, finance, etc., and make them analysis-ready.
- Define the dimension or measure for each data set and add filters to drill down the data further. Connecting to the right set becomes easier.
- Use the quick information menu on the dashboard to identify the last updated data source
Act confidently with actionable data
Real-time dashboards and consistent data help teams to explore insights and deliver differentiated offerings for various customer groups.
Request Demo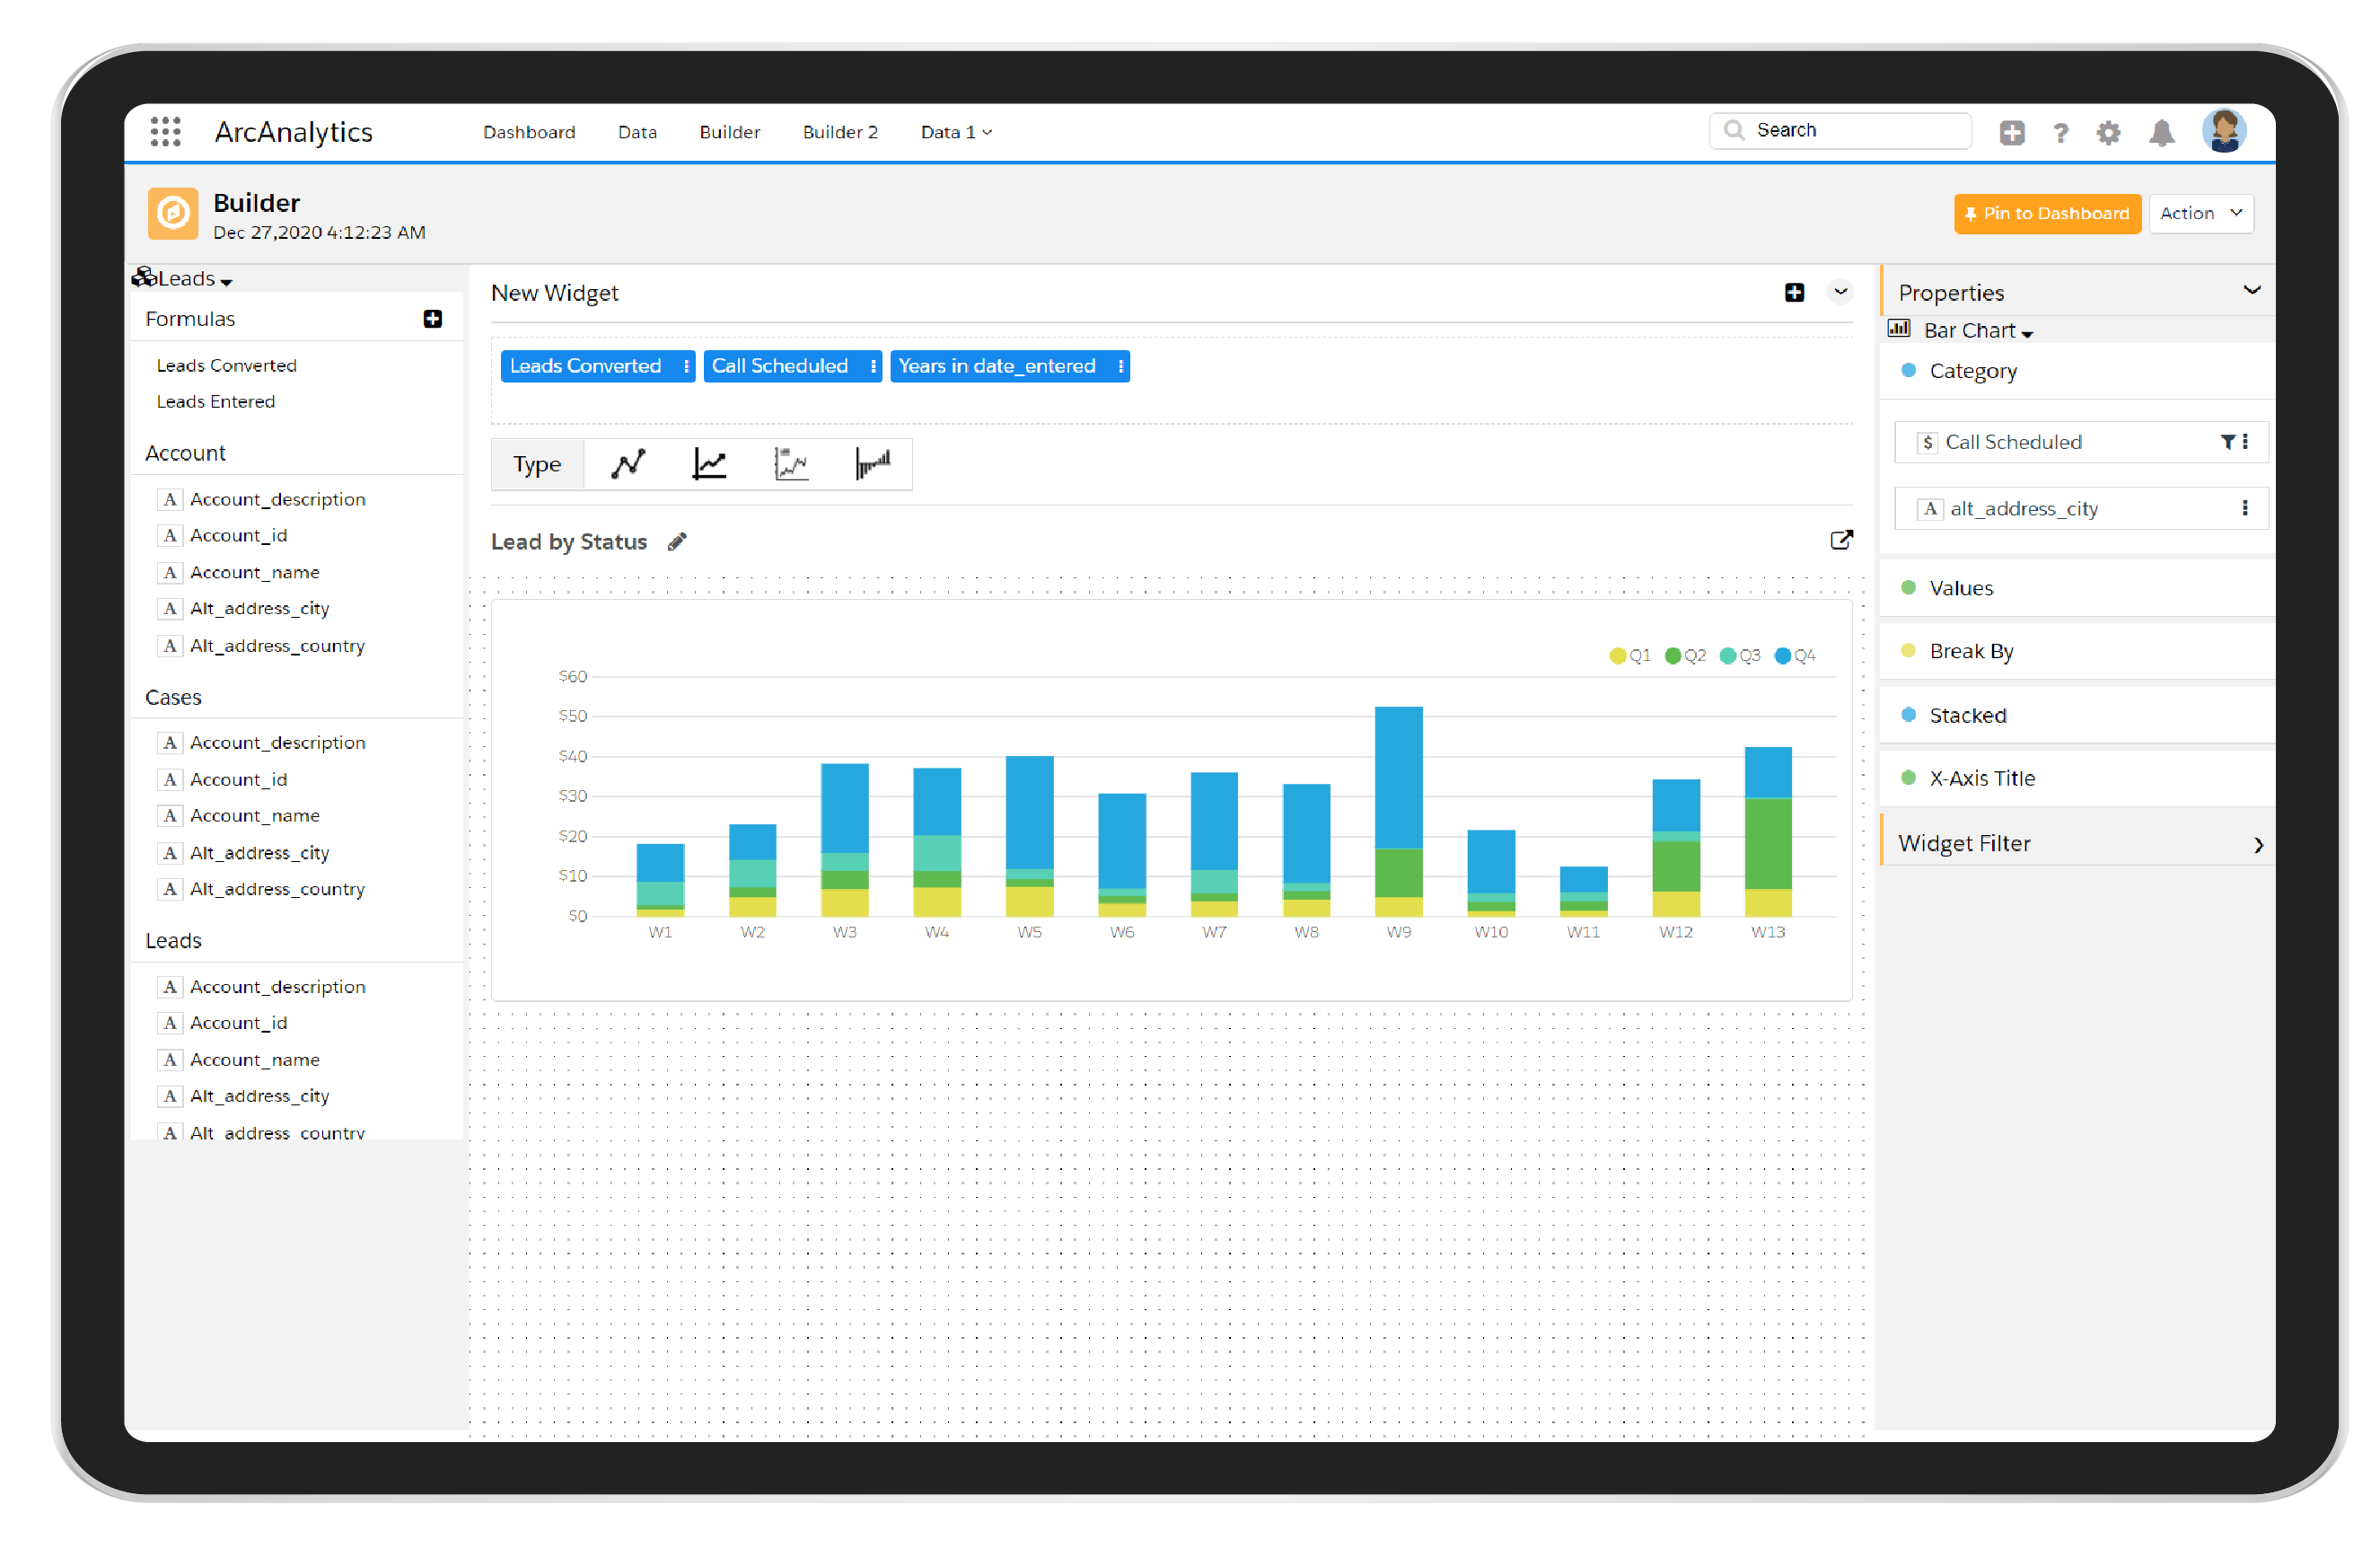
Want to explore?
Find out how ArcAnalytics help you leverage the power of data with fresh insights.