It's two in the afternoon and the last truck is back. The invoices are in, the cash is counted, the returns are logged, the settlement balances. Every case that went out is accounted for, and so is every case that came back.
Nothing went wrong today. Your system did exactly what you bought it to do.
And you still can't answer a simple question about your own business: which two of your accounts are paying different prices for the same product?
That gap isn't a flaw in your software. It's the edge of what it was built for.
Two different jobs
There's a difference between recording something and explaining it, and this industry has spent thirty years getting very good at the first one.
Recording is the job of capturing the day accurately. What was loaded, what was delivered, what came back, who signed, who paid, how far the truck went. Every route accounting system on the market exists to do this, and most of them do it well. Your invoices are right. Your settlement balances. Your books match.
Explaining is a different job, and it answers a different question.
A record tells you what happened. It can't tell you what keeps happening.
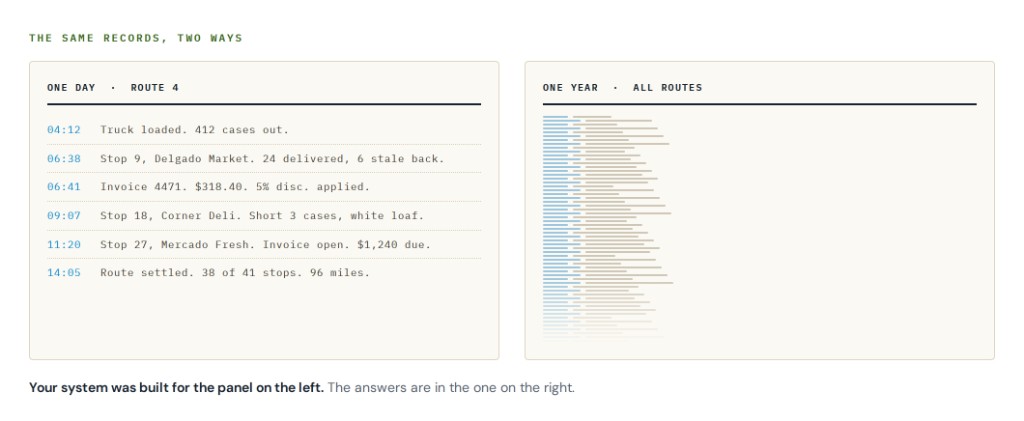
Those two questions sound almost the same. They aren't, and the space between them is where most of the money goes.
Notice that everything is built around a day
Look at how your system is put together. Nearly all of it is organized around a single day.
The load sheet is for one morning. The settlement is for one afternoon. The daily sales report covers one day. Even the weekly and monthly summaries are just days added up.
That's not a mistake. It's the right way to build it, because the day is the unit you actually manage. You need to know what happened today so you can pay the driver, invoice the store, and load the truck tomorrow.
But "what keeps happening" doesn't live in a day. It lives across two hundred and fifty of them.
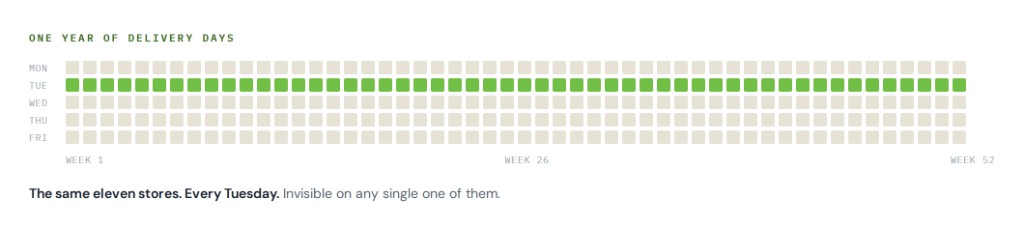
A loaf that comes back stale from the same eleven stores every Tuesday isn't visible in Tuesday's numbers. It only shows up when you put all the Tuesdays next to each other. And nothing in your system does that, because nobody ever asked it to.
The reason nobody noticed
Here's what makes this easy to miss. Your data is complete.
If something were missing, you'd know about it. Missing information announces itself. The paperwork doesn't come back, the invoice doesn't match, somebody calls.
But nothing is missing. It's all in there. Every stale return, every discount, every late payment, every mile, recorded properly and filed away.
That completeness is exactly what hides the gap. When everything is written down, it's easy to assume everything is known.
Written down and known aren't the same thing.
Nobody can read a year
Take a fairly ordinary operation. Six routes. Three hundred and eighty accounts. Two hundred and fifty delivery days. A few dozen products.
That's several million lines of delivery history.
You could read any one of those days and understand it completely. You've been reading them for thirty years and you're good at it. But nobody reads several million lines, and no amount of experience changes that.
It isn't a knowledge problem. It's arithmetic at a size people don't do.
Which is why the answer has never been to look harder or pay closer attention. You already pay closer attention than anyone else in the building. There just isn't a version of you with a spare month to line up the year and go through it.
What turns up when somebody does
When that reading finally gets done, three kinds of things come out of it.
The first is something you already knew, sized properly for the first time. You know you lose money on stales. Losing eight to twelve percent of product this way is normal in bread, which on a three million dollar operation runs into the hundreds of thousands a year. What you don't know is that most of it might be one product on three routes. You were right about the loss. You just never saw where it lived.
The second is the opposite of what you'd assume. Ask most owners which route is their strongest and they'll name the one with the highest revenue, because revenue is the number sitting in front of them. Profit per route is a different number, and it's rarely in the same order. That's how a route that loses money survives for years while a good one goes underinvested.
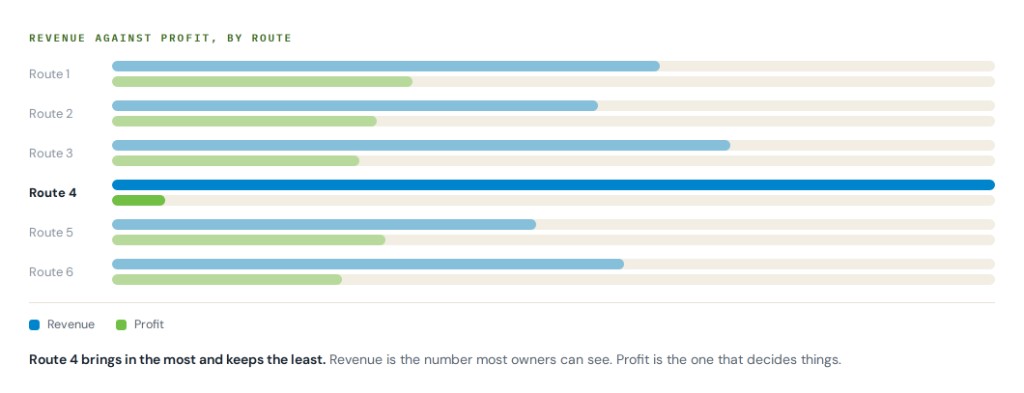
That is the plainest example of how DSD Operational Intelligence improves route profitability. Not by making the trucks faster, but by telling you which stops were never worth the trip in the first place.
The third is something nobody would ever think to check. Nobody wakes up wondering whether two accounts are being charged differently for the same case, or whether a promotion that was supposed to end in March is still running. These aren't questions you forgot to ask. They're questions that never occur to anyone, because there's no reason they would.
What to call it
We've started calling this DSD Operational Intelligence, mainly because it needed a name and nothing that already existed fit properly.
It isn't a dashboard. A dashboard is another way of looking at today, and you already have today covered. It isn't a replacement for your route accounting system either, and it isn't a reason to switch anything.
It sits on top of what you already run, reads what you've already recorded, and answers the second question. Not what happened. What keeps happening, and what it's costing you.
That's all it is. If you want the longer answer to what DSD Operational Intelligence is, where the idea came from, and what it takes to get started, we have written that up separately.
What it actually answers
The benefits of DSD Operational Intelligence are easier to understand as a list of questions than as a list of features. Every one of these is something you could answer today only by sitting down with a year of your own records.
Which accounts pay different prices for the same product. Which discounts went out without your approval. Which promotions are still running after they were supposed to stop. Which accounts have been quietly ordering less, month after month.
What hasn't really moved in months. What keeps coming back stale, and from which stores. What runs out at the same stores on the same day, week after week.
Which routes actually make money, not just which ones bring in the most. Which individual stops cost more to serve than they bring in. Where two trucks are covering the same ground.
Who is late every single time, as opposed to who was late once. Who is over their credit limit and still getting deliveries.
Which corrections get made over and over, and where those errors actually start. Which prices and credits went out without a sign-off.
Which stores keep getting shorted. Where deliveries keep slipping.
None of that is hidden. It's all sitting in what you've already recorded.
The honest part
If you've been doing this twenty or thirty years, somebody has sold you something like this before, and it turned out to be a screen you opened twice and forgot about. That's a fair thing to be suspicious of, and we'd rather say so than pretend it never happened.
The difference is in what lands on your desk. A dashboard gives you a chart and leaves the thinking to you. What we're describing gives you a short list: this product, this store, this route, this week, and roughly what it's costing. Specific enough to do something about on Monday morning.
Your system did its job. It recorded the day, every day, for years, and it did that well enough that the answers are already sitting in there.
Somebody just has to read them back to you.