How Route Optimization Can Help Bakeries Meet Same-Day Delivery Expectations
When route costs are visible, optimization stops being about time and starts being about margin.
Read More

In our last edition, we talked about what happens when institutional knowledge walks out the door. This time, we are looking at something quieter but just as expensive: most family distributors cannot tell you which of their routes actually make money.
They know total revenue. They know total costs, roughly. But ask which routes are profitable and which are bleeding margin, and the honest answer is usually: “I think Route 1 and Route 3 are my best.” Think, not know.
A bread distributor runs seven routes. Route 2 brings in $8,200 a week and has always been the flagship. Route 6 does $4,800 and rarely gets discussed.
But Route 2 carries the highest stale returns in the fleet, the driver runs long, and three accounts have been on extended credit for over a year. Net profit after all costs: $620 a week. Route 6 runs tight, finishes on time, and nets $1,740. The flagship is the weakest performer. The route nobody talks about is carrying the business.
F&B wholesale distribution runs on some of the thinnest margins in any industry: 1 to 4% net, depending on the vertical. A bread or tortilla distributor operating at 2% net margin has almost no room for a route that is quietly losing money. One underperforming route does not just break even. It consumes the profit that two or three other routes worked all week to generate.
McKinsey’s survey of 220 distributors found that the industry has grown revenue by roughly 7.5% per year since the last recession, but margins have stayed well below pre-recession levels. Revenue keeps climbing. Profit does not keep pace. The reason is not that distributors are selling poorly. It is that the costs hiding inside individual routes, specific stores, and particular products are invisible until someone breaks them apart.
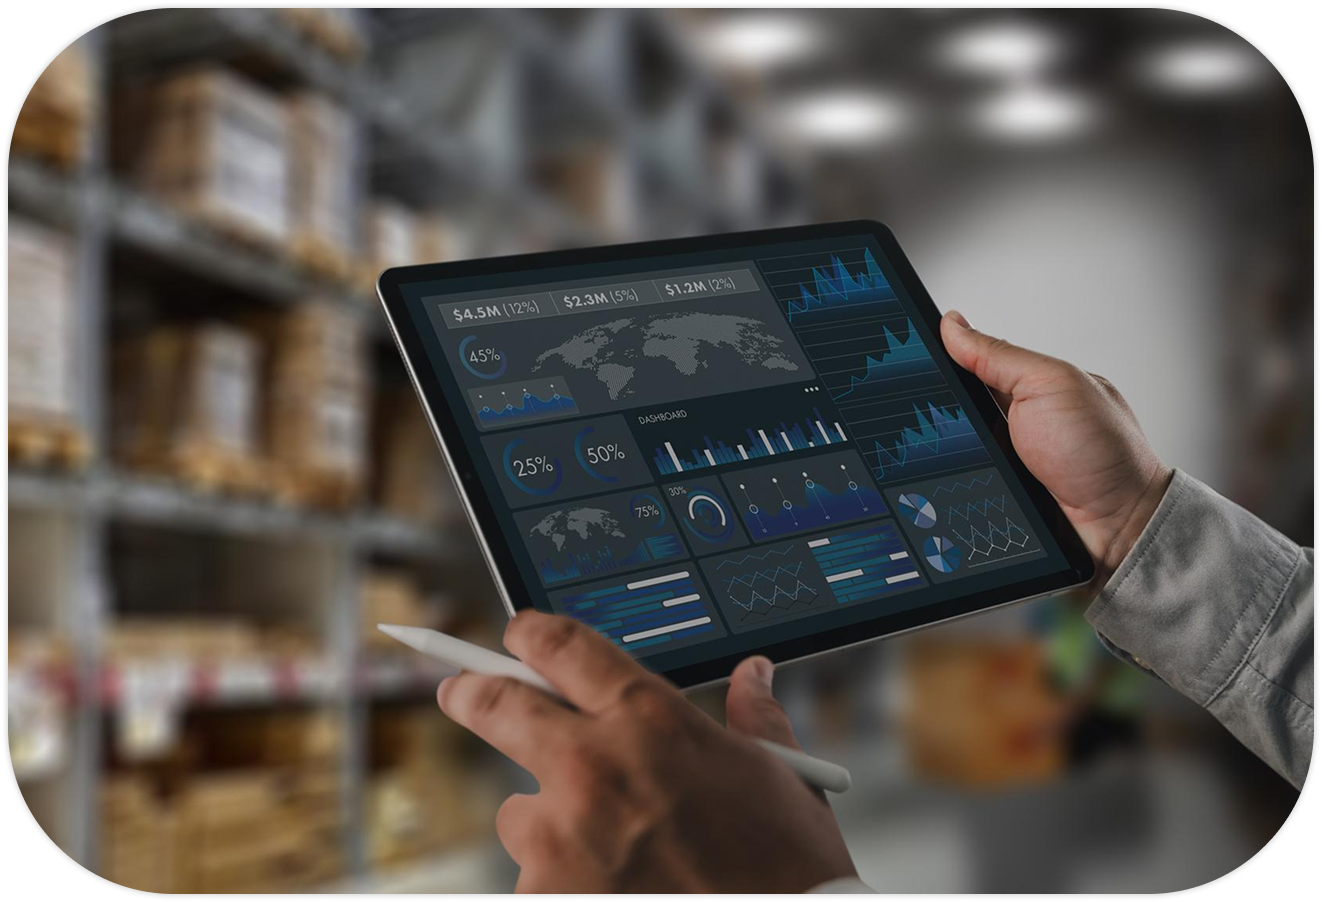
Working with distributors across bread, snack, coffee, and tortilla, the one pattern I see more than any other is this: they manage routes by revenue. The first time they see routes ranked by actual profit, there is always a pause. What follows is a shift in how they run the business:
These are not technology insights. They are business insights. But you cannot get there without the numbers at the route level, the store level, and the product level coming together in one place. That is what we built bMobile around: connecting the data a distributor already creates every day so the picture assembles itself.
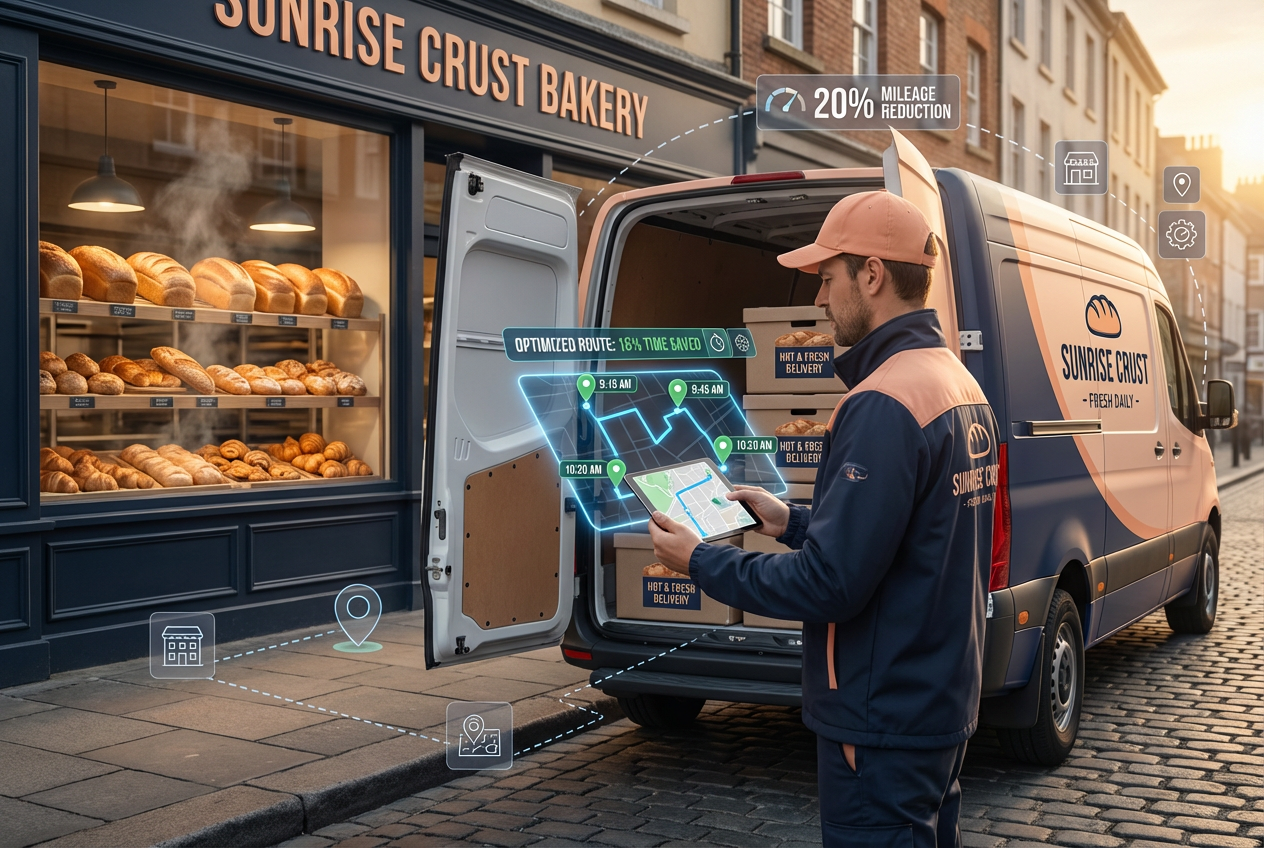
How Route Optimization Can Help Bakeries Meet Same-Day Delivery Expectations
When route costs are visible, optimization stops being about time and starts being about margin.
Read More
Inventory Management + Routing: The Complete Guide to Optimizing Stock, Warehouses, and Delivery
The connection between what gets loaded and what comes back is where route profitability starts.
Read More
How Snack and Beverage Distributors Stay Competitive
Competitive distributors do not just track what they sold. They track what it cost to sell it.
Read MoreShare this with your route managers, your office team, or anyone who decides which routes get investment and which get cut.
Until next time, stop managing routes by revenue. Start managing them by profit.