Most bread route operators talk about stales as an inventory problem. They are not. Stales are a profit problem dressed up as an inventory problem. Once you see them that way, you start running your route differently.
Here is the math that should be on the wall of every depot. The Full Truck, which tracks independent bread route economics across the U.S., reports that stales typically run between three and eight percent of revenue on most bread routes. Tightly managed routes hold under four percent. Loose ones drift to eight, ten, sometimes twelve percent. On a mid-size route doing $500,000 in annual sales, that is a swing of $15,000 to $40,000 a year. Same accounts. Same product. Same brand. The operator is the variable.
That number is not an inventory variance. That is real, take-home money. It is what keeps the route in your family for years to come.
Why you pay for every stale loaf
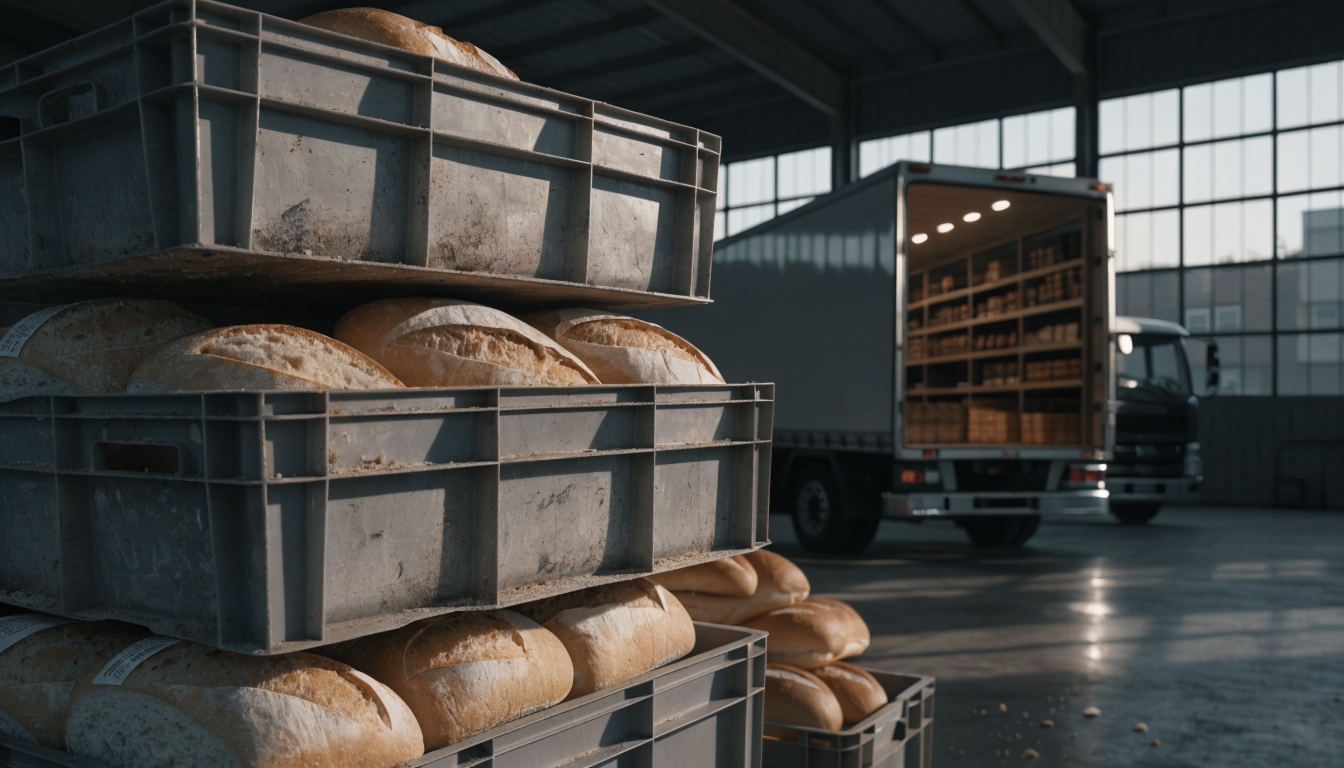
Here is how stales work. When a loaf of bread reaches its sell-by date, the store cannot sell it anymore. The store then takes a credit for that loaf. That credit comes off your check, not the brand's. The brand was already paid when you bought the loaf at wholesale.
Different brands handle stale credits differently. But the bottom line is always the same. When a loaf goes stale, you pay. Not the brand.
And the cost is bigger than it looks. A $4.99 loaf that goes stale is not a $4.99 loss. You paid for that loaf at wholesale. You paid to drive it to the store. You spent time placing it on the shelf. Then the store takes a credit on top of all that. Add it up over a year, and stales decide whether your route still pays you.
Why most operators are running blind
Talk to ten bread route operators about their stale rate. Eight of them will tell you a single number, usually a guess. About six percent. Around five. Maybe eight in the summer.
That single number is the whole problem. Stales do not happen at the route level. They happen at one store, on one SKU, on a specific day of the week, often during a specific promo. The operator who knows his stale rate is six percent does not know that one of his fourteen stores is running eighteen percent and dragging the average. He does not know that eighty percent of his stales come from three of his two hundred SKUs. He does not know that his Friday loads are stale-heavy because the store ran a buy-one-get-one on Tuesday and nothing moved until Sunday.
That is the actual problem. Not stales themselves. The inability to see stales at the level of detail where you can do something about them.
The five levers that move stales
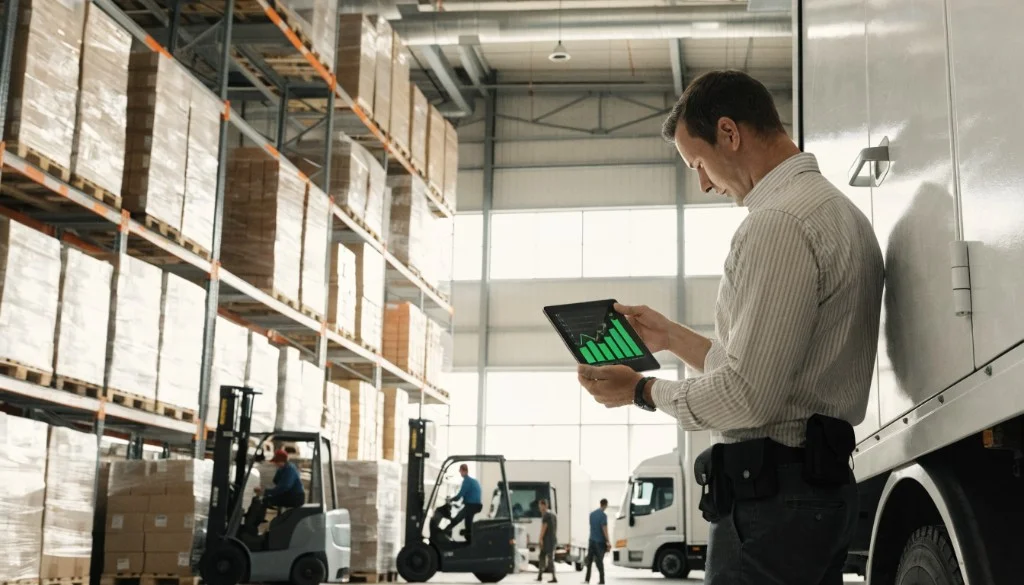
We have watched a lot of operators in the U.S. move from eight percent stales to under four. They do not do it by working harder. They do it by working on five specific things.
Per-store demand history at the SKU level. Not "this store buys thirty loaves a week" but "this store buys fourteen white, nine wheat, five multigrain, four buns on Mondays, and twenty percent more on Fridays when the seniors' discount is running." If you do not have that data, you are loading your truck based on memory and a feel for the route. Memory is wrong about a third of the time. The third you are wrong is your stale percentage.
First-in-first-out at the shelf, every visit. Yesterday's loaves move forward. Today's go behind. The operator who does this religiously cuts shelf-age stales by about half compared to the operator who eyeballs it. This sounds basic. It is also the lever most operators stop pulling after the first six months, because it is dull and it costs an extra two minutes per stop. Two minutes times twenty stops is forty minutes a day. The operator who keeps pulling that lever is the operator who is still in business at year ten.
Promo-aware load planning. When the brand runs a buy-one-get-one on a particular product, the regular version of that same product on the next shelf stops moving. You know this. You have lived this. But you keep loading the same amount because the promo is brand-controlled and the load sheet does not change. The fix is to drop the regular load by thirty to forty percent during the promo window and ramp it back up the week after. Most operators carry too much regular product during promos and too little after, which is exactly backwards.
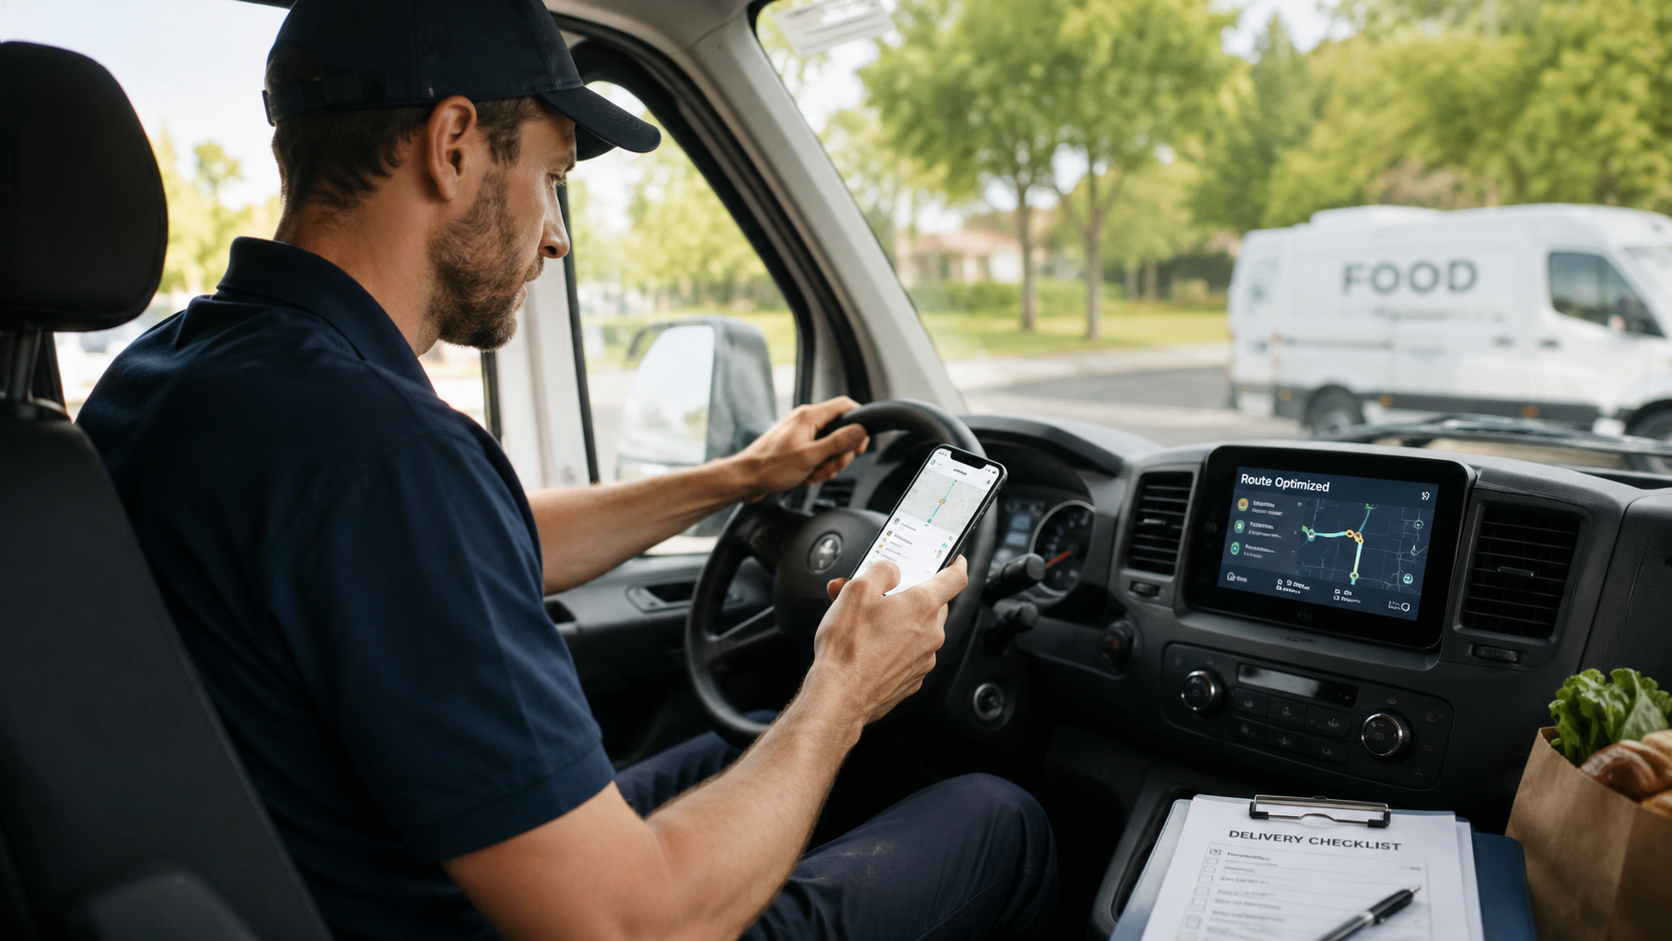
Multi-brand catalog visibility. Many independent bread route operators are running eight to twelve brands on their truck. Two hundred SKUs is normal. Three hundred is not unusual. No human brain holds the demand pattern of three hundred SKUs across twenty stores. You need a system. Operators running route software like bMobile pull last-week's sales for every store and SKU before they load the truck. Operators who try to do it from memory pay the difference in stales every single week.
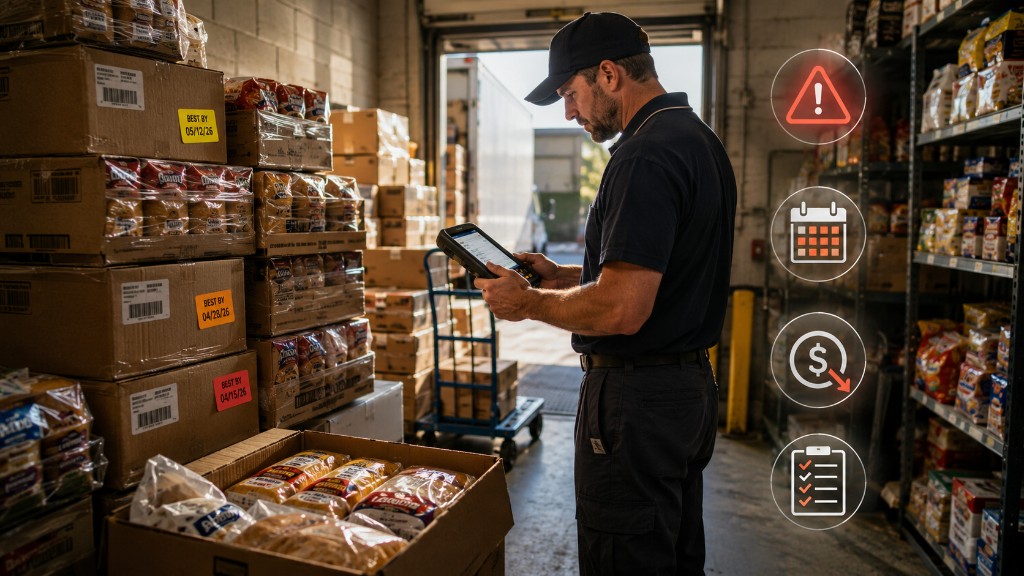
Returns captured at the moment of the pull. Most operators write down stales on paper at the truck. Some of them write down store and SKU. Almost none capture the reason: was it past code, was it damaged, was it replaced by a different size, was it removed at the store's request? If you do not capture the reason, you cannot figure out the cause. If you cannot figure out the cause, you will see the same pull next week.
What the top ten percent do differently
The bread route operators who run consistently under four percent stales share a way of thinking, not a tool. They treat the route like a portfolio.
A portfolio operator knows that not every account makes money. Two of his fourteen stores might be running at break-even or worse, and he knows it, and he is making a decision about whether to keep them. He moves slower-selling SKUs between stores when he can. The bagels that are not moving at Mr. K's Market are riding to Sal's Bodega the next morning, where they will. He builds his load on Tuesday based on what actually happened Monday, not on what he loaded last Tuesday.
He also reviews weekly, not yearly. The operator who looks at his stale percentage once a year at tax time is using stales like a thermometer for a fever he could have treated months ago.
The four-percent operator has one more thing the eight-percent operator does not. He has a written process. Not a binder. Just a small set of rules. Pull stales first, restock second. Tag every return with store, SKU, date, and reason. Review the worst three stores every Sunday night. Adjust next week's load. That is it. The simplicity is the point.
The 90-day path from eight percent to four percent
If you are running at eight percent stales right now and want to cut that in half, here is the sequence we have seen work with the operators we have spent time with.
In the first two weeks, you capture a baseline. Every stale, every return, tagged to store and SKU. On paper, this is painful and easy to get wrong. With route software like bMobile, this happens automatically as the driver moves through the route. Either way, no analysis yet. Just data.
In weeks three and four, you find your top five stale stores. These are almost always the same five stores that were also your highest stale stores three years ago. Operators know this in their gut. The data confirms it and makes it impossible to ignore.
In weeks five through eight, you right-size the load for those five stores. Cut whichever SKUs are showing more than eight percent stales at that store by twenty-five to forty percent for the next four weeks. Watch what happens. In most cases, sales at those stores stay flat or drop by a small amount. Stales drop by sixty percent or more. The net is more dollars in your pocket.
In weeks nine through twelve, you apply the lessons across the rest of the route. By now, you have a feel for which SKUs are stale magnets and which stores are over-ordering. You make smaller adjustments across the remaining stops.
The math is real. If you are running a $500,000 route at eight percent stales and you drop to four percent, that is $20,000 a year in additional commission. Most operators who commit to the sequence hit that target inside ninety days. Some go further. The ones who get to three percent are not better operators. They are operators with better visibility.
The work, in plain terms
There is an old saying among bread route operators that the route makes the money. It does not. The operator makes the money. The route is just the asset. What separates the operator running at four percent from the operator running at twelve percent is not luck, not territory, and not brand. It is a small set of habits, applied weekly, with data that is good enough to make decisions on.
Stales are the cleanest signal of how well an operator runs the business. They tell you how well you load, how well you rotate, how well you watch your stores, and how honest you are with the data you have. Everything else in the business depends on those four habits.
If your stales are at eight percent or higher, you are not running a bread route. You are running a bread route minus $20,000 a year. The $20,000 is still there. It is sitting on the wrong side of your books, and the work to get it back is real but doable.
That is the work.